Better With The Ball? It's Just A Shot Away
The original version of this article appeared in These Turbulent Times, and the stats (sourced from EPLIndex) were correct up to 29 March 2013. I've now updated it to include all of last season so that it covers 1,900 matches worth of data in total, and re-written parts of the article accordingly. I have read a couple of very interesting statistics with regards to the bearing that having more shots on target (SoT) than your opponent has upon winning football matches. On 24th February, The Guardian advised us:
Of the 181 games won in the Premier League before last weekend, the team who had the most possession only won 103 – 57% in total. The team who had more shots on target than their opponents won 128 matches – 71% of the total.
Then this article, which used a larger sample of 987 matches, chipped in with:
Winning the SoT battle in non-drawn games, results in a team winning that fixture 71.73% of the time and losing the fixture 19.35% of the time.
It seems pretty conclusive; have more shots on target than your opponent, and you'll win around 71% of the time (when excluding drawn matches). This isn't in itself that surprising, but it's valuable to be able to quantify it from a performance monitoring point of view all the same. But a thought occurred to me; you could win the SoT battle by anything from one in a close game performance-wise to potentially any number (and for the record, Liverpool's best figure since August 2008 has been twelve on two occasions). Surely accounting for this differential might provide an even better guide than simply who had more shots on target? I therefore decided to look at 'TSoT%' (total shots on target percentage), which is the proportion of the shots on target that a team has in a match. As a simple example, if one side has six shots on target and the other four, then the former has a TSoT% of 60%, and the latter 40%. The following graph shows Liverpool's points-per-game and win percentages for ten percent slices of TSoT%, from the start of the 2008/09 until the end of last season:
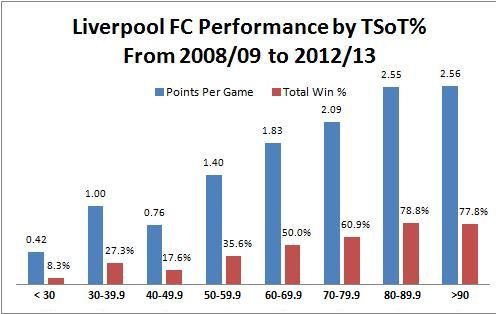
The Reds have had five matches in this period where the opposition didn't have a single shot on target; four of them came during 2008/09, and sadly two of them were (title costing?) 0-0 draws with Stoke City. In fact, adding the 1-0 defeat at the Britannia Stadium in 2011/12 to the aforementioned games makes a total of five points that the Potters have taken off Liverpool from three matches for a sum total of one shot on target, and that was a penalty. Typical! The key thing to note with regards to the TSoT% data is that Liverpool have won just eight (19.5%) of the forty-one matches where they had less than half of the shots on target. This occurred twice in 2012/13; 3-2 wins against West Ham and Tottenham Hotspur. It's fair to say that the Reds were perhaps lucky to triumph in those matches on the balance of play, and the SoT figures back this notion up. As twenty-five of those forty-one matches were lost, Liverpool average just 0.78 points-per-game when they have less than 50% of the shots on target. At the opposite end of the scale, the Reds average 2.03 points across the 124 matches when they've had a TSoT% of more than 50%. Only 16.1% (twenty) of those games were lost (including unlucky defeats against Manchester United last season, or Tottenham in 2008/09, for instance), illustrating again the value of out-shooting your opponents. The idea of being better in front of goal rung a bell with me in terms of a famous quote Brendan Rodgers offered up at his fan site briefing in September 2012:
I’ve always enjoyed and worked with the statistic that if you can dominate the game, with the ball, you have a 79% chance of winning a game of football. If you’re better than the other team, with the ball, you’ve got an 8 out of 10 chance of winning the game.
Based on the question asked, it would appear that Rodgers was talking in terms of possession, yet The Guardian's aforementioned research suggests his figure of 79% is a long way from the truth if so. The interesting thing here is that of the 127 Liverpool league matches since August 2008 that haven't been drawn, and where one side has had more shots on target than the other, 78% have been won by the side who had the larger SoT figure. Is this what should be meant by being better with the ball? It may likely be a coincidence, but Rodgers seems to have been close to the truth with his quote, though perhaps not in the way he actually intended. Having seen the impact that TSoT% has on individual matches (for Liverpool at least), my next aim was to see how season-long TSoT% performance corresponds to league performance. The graph below shows TSoT% against Premier League points for the period 2008/09 to 2012/13, and as you would expect, it displays strong correlation:
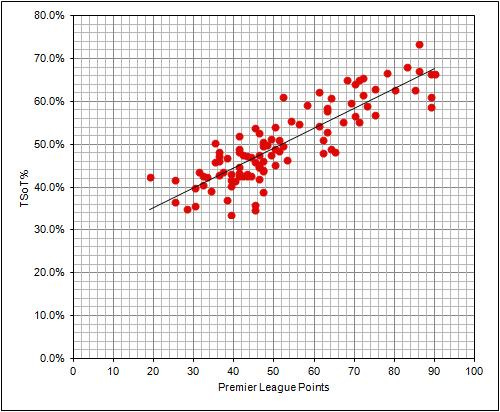
No prizes for guessing which dot represents Liverpool's 2011/12 campaign; the spot that's one of the furthest from the line, where 52 points and 61% meet. Between 2008/09 and 2011/12, the TSoT% of 61.1% posted by Liverpool in Kenny Dalglish's one complete season was the highest by a team not in the top four, and better than three teams who did finish in a Champions League position during that period. Had the Reds' scored and conceded at the rate they should have implied by the line on the above graph, then they'd have bagged over seventy-four points, and a place at Europe's top club table. Instead, Kenny Dalglish's men scored just 22.7% of their shots on target, which is the sixth worst conversion proportion of the eighty teams in the original study. Even matching the average conversion rate of 29.6% would've lead to fourteen more goals, which would have increased their goal scoring output by 30%. Remarkably, after this article was written for the book two teams bypassed the aforementioned 61.1% TSoT% at the end of last season and failed to finish in the top four, and one of them was Liverpool! Brendan Rodgers posted a TSoT% figure of 62.2% in his debut Reds campaign, which bettered the percentage amassed by eight of the twenty top four finishers in the past five seasons. To their credit, fifth placed Tottenham Hotspur did even better and posted the seventh best TSoT% of the one hundred teams in the extended study, with 65.4%. So why did Liverpool fall so far short of the 'promised land' last season? Despite scoring a whopping seventy-one goals, the Reds only actually converted 30.6% of their shots on target, which is only a shade above league average (29.8%), and below the average for teams finishing in the top four (33.6%). Worse happened at the back of the team, where 30.5% of shots on target against found their way into Liverpool's net; this compares unfavourably with a top four average of 26.2%, and only two of the twenty teams to finish in the top four in the last five seasons posted worse figures (and both were Arsenal, strangely). I'm sure the fact that Sunderland only conceded 26.1% of the shots on target that they faced in 2012/13 did not escape the attention of Liverpool's transfer committee. I have plotted the average TSoT% for each league position over the last five seasons, to try to establish some benchmarks for future use:
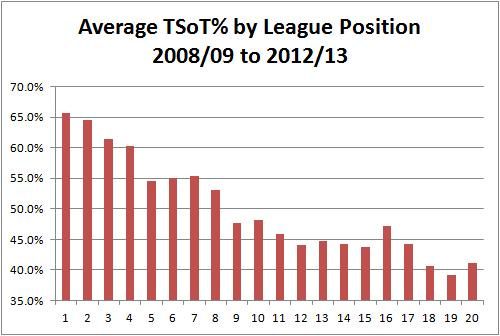
We can see that it broadly breaks down into four bands:
60% plus should see a team in the running for a top four finish.
50 - 55% puts you in contention for a Europa League place.
Comfortably above 40% should see a team stay up.
Around 40% is relegation form.
Breaking it down into 5% chunks can also give an indication of the kind of points tally a team is likely to post depending on their TSoT% figure:
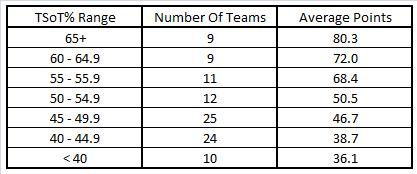
Obviously there is more to being a successful side than TSoT%, as spectacular under- or over-performance at either end of the pitch can make a massive difference; I've already demonstrated how the Liverpool side of 2011/12 under-achieved, but the opposite is true of the Manchester United team of 2012/13. With a TSoT% of 58.8%, they should really have been in the mix for fourth place at best, yet by converting 40.4% of their shots on target (which is 1.5% better than the best figure posted by any other team in the last five seasons), they were able to walk away comfortably with the league title. But what does this all mean for the Liverpool side of 2013/14? After the 4-1 defeat of West Bromwich Albion, the Reds have a TSoT% of 55.7%, having had 54 shots on target whilst allowing 43 to their opponents. Much like United in Fergie's final season, over-performance at one end of the pitch means that they have been able to sit higher in the table than their TSoT% suggests they should. But unlike United, it is at the back of the team where the significant improvement has occurred.
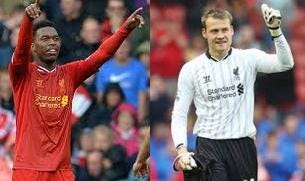
Whilst the Reds' attackers have only shifted their conversion percentage from 30.6% up to 31.5%, the defence (and particularly Simon Mignolet) have lowered their conversion against percentage down from 30.5% to just 18.6%. No team in the past five full seasons has posted a lower defensive figure than 19.8%, so whilst Liverpool will do very well to maintain this figure across the remaining twenty-nine league games this season, it's clear that this improved performance has enabled them to win tight games that previously they might not have. As an example, Mignolet has saved 35 of the 43 on target shots he has faced this season, whilst Reina saved only 26 of the first 43 last season; a nine goal turnaround, which has seen the Reds reap the benefit. It's clear that TSoT% is not the most definitive factor in winning games, and it's not as if other stats are not still important of course, as they indirectly contribute to TSoT%; the likes of final third passing accuracy and clear-cut chance creation are key up front, whilst defensive errors and blocked shots will play a part at the back of the field. But if you want one simple indication of who deserved to win a match or which team should finish where in the league, this seems a very good place to start indeed.
Recent and related posts you might like: Newcastle 2 Liverpool 2: Stats Zone Analysis - Should Liverpool have done better against the ten men of Newcastle? Liverpool’s Most Successful Formation Is… – …not the one you might think! Second Half Slump? Controlling The Result – Although Liverpool have had some poor second halves in 2013/14, they’ve had better control than you might think… LFC Pass Combination Heatmaps 2013/14 – A look at which players have been most involved pass-wise, and who they’ve linked up with in every league match this season. Please check out my other articles, and follow me on Twitter or via Facebook. Thanks.
