
Covering Distance in the Champions League
People love the idea of physical data but it's hard to come by. Let's look at Liverpool's distance covered stats in Europe this season.
A lot of football fans don’t care about a lot of football metrics. Who can blame them? Who’s bothered about tackles or pass completion or possession regains when football is solely about winning the six-yard scrum on a corner?
One thing that seems to generate interest is physical data, at least based on tweets I’ve received over the years. People want to know who ran the furthest or the fastest. Is there anyone who failed to put in the hard yards who we can blame for the latest defeat?
I think the clamour for these statistics is why Josh Williams chose the handle Distance Covered. Fans want the numbers without necessarily understanding how to interpret them. Running stats are viewed as the answer to solving football when the numbers that drip out into the public domain are usually shorn of context. The possession share and the game state are just two factors that affect how far or how fast a player has to run.
We at least know Jürgen Klopp would set his team a collective target. Players from both Mainz and Dortmund revealed what the German demanded ahead of him taking over at Liverpool.
“In his first year he said he wouldn't guarantee anything apart from that when we reached 120km per game then it would be much harder for us to lose,” said Patrick Owomoyela, who played under Klopp at Dortmund. “He actually offered us a day off when we reached that target. He thought that if we reached that then we would win the game. And from then on it became easy because we understood that his plan would work.”
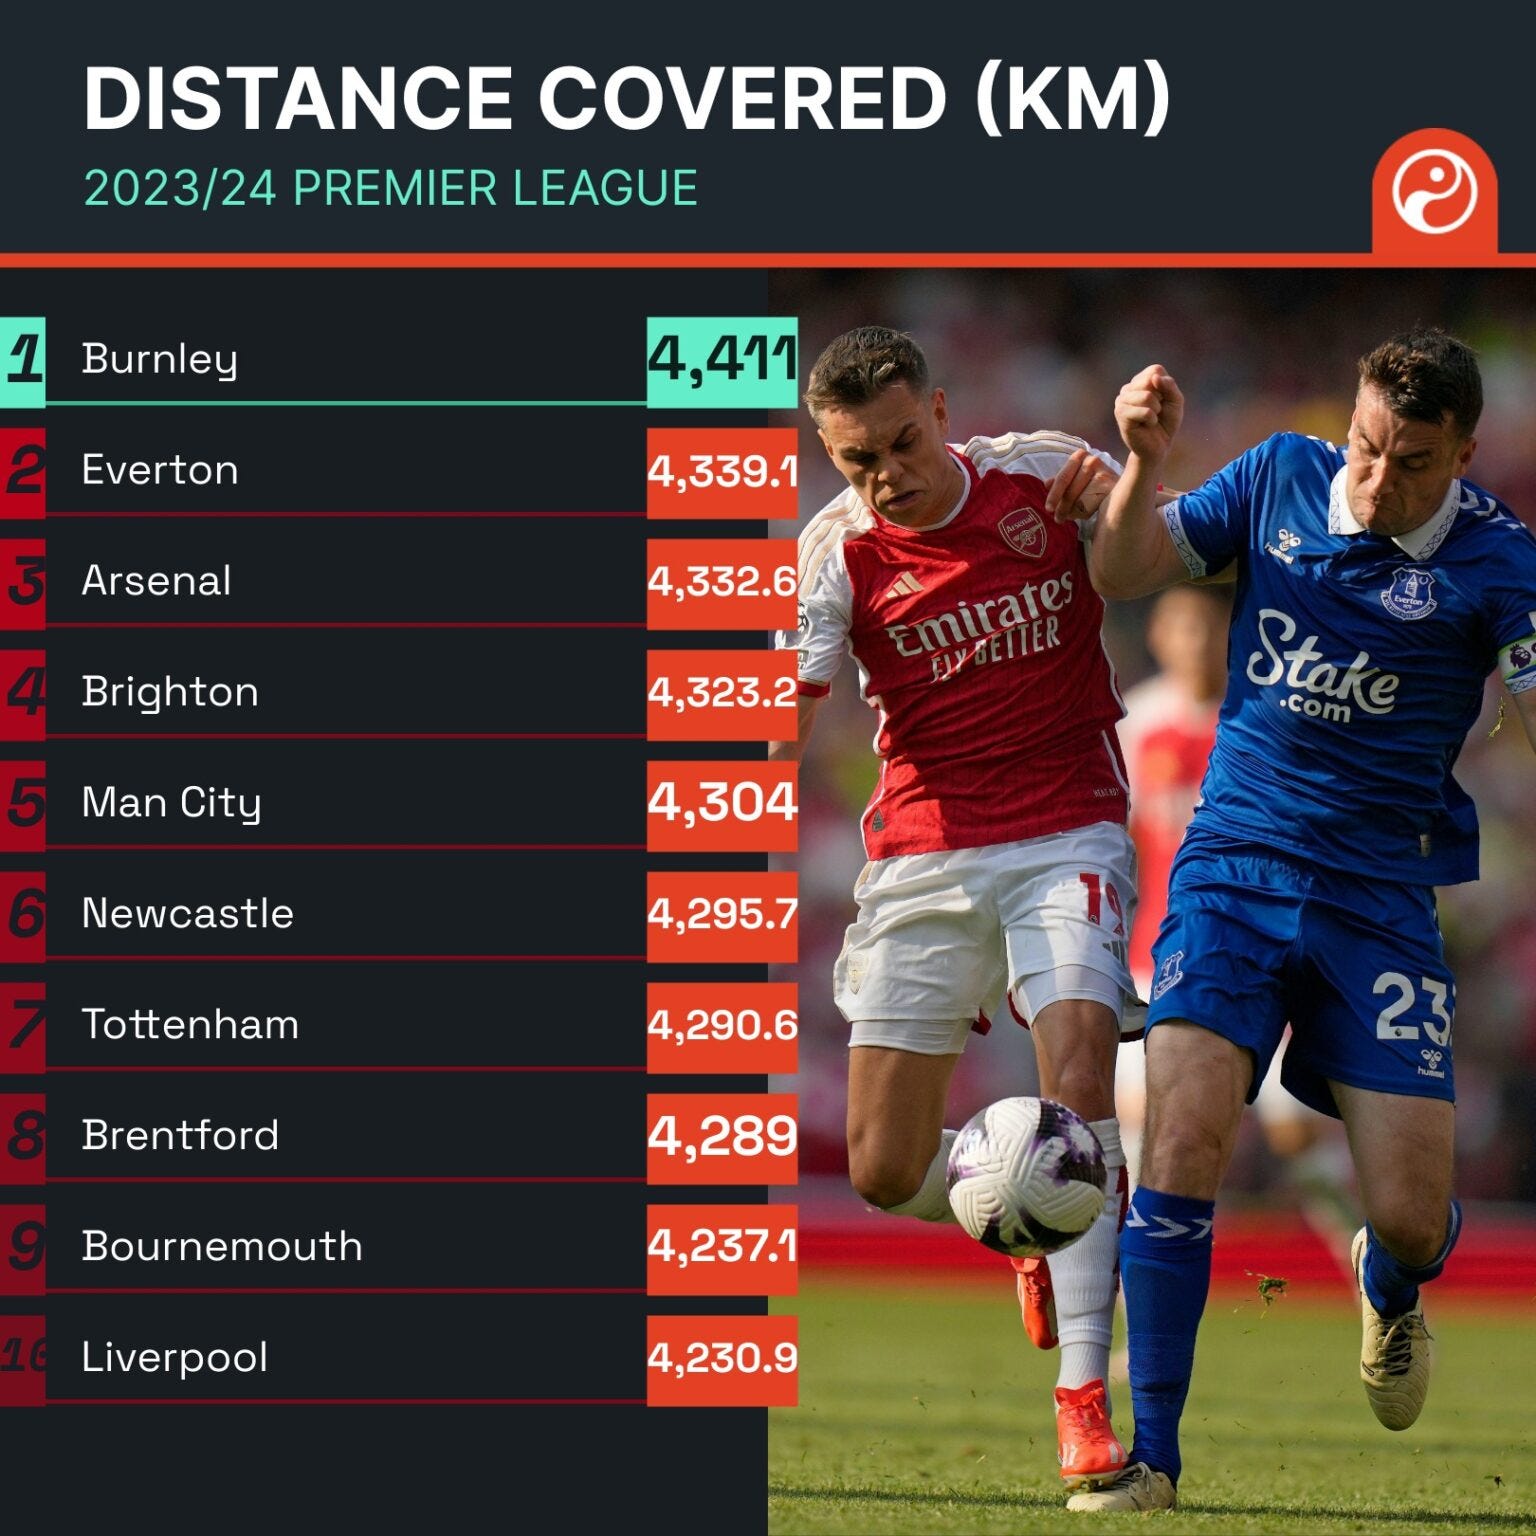
Klopp may have dialled down his benchmark in later years. Squawka revealed after his final campaign in England that the Reds had averaged 111.3km per Premier League game in 2023/24.
Sports scientist Simon Brundish recently noted that “across his final three seasons, Liverpool averaged around 116 kilometres per match,” suggesting Klopp’s last dance may have been the most restrained one. He did look exhausted, in fairness.
There’s clearly no correlation with success. Burnley went down with a whimper two seasons ago despite topping the above chart while Aston Villa (who were 20th for distance covered) unexpectedly finished fourth. Run smarter, not harder?
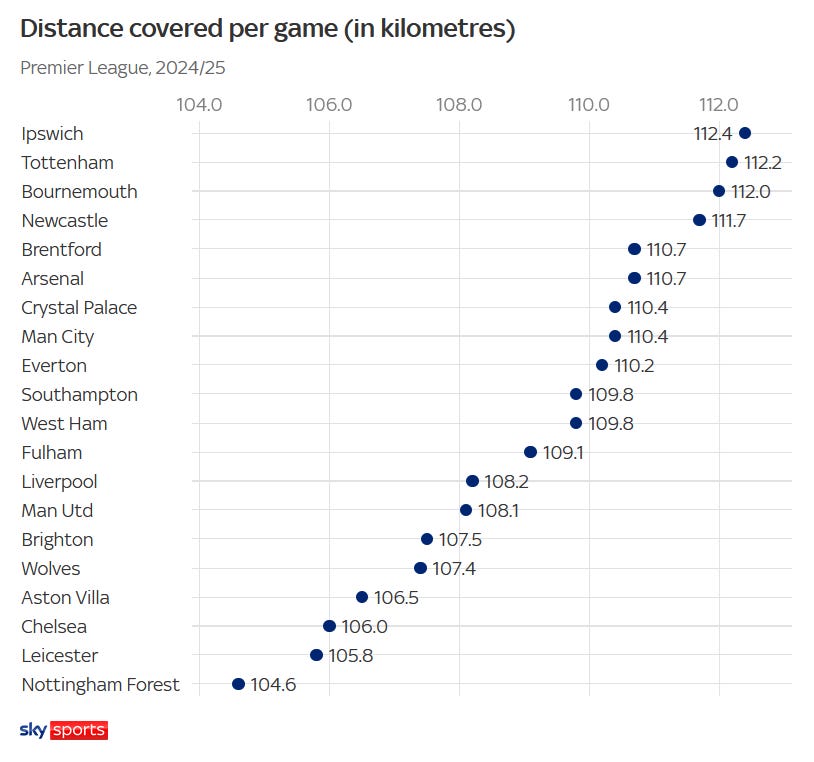
Arne Slot appears to think so. A Sky Sports article from February 2025 on Nottingham Forest included the Premier League distance covered per game figures for last season to that point. The Reds had eased off compared with the preceding campaign, though maybe that was just a result of having to chase far fewer matches. Liverpool were more often able to play on their terms.
Fotmob proudly announced ahead of 2025/26 that they would be carrying physical data this season. Then they withdrew it, at least for the Premier League. However, the Champions League statistics remain available. With Liverpool returning to the competition next week, it’s a good time to run through some distance numbers. Sprints will be covered in the next edition of the newsletter.
The Reds are ranked lowly (joint-27th) for kilometres covered per game at Europe’s top table. Chelsea are bottom on 107.2km, with Real Madrid (108.3) and Paris Saint-Germain (110.6) also below Liverpool (110.9).
As we look ahead to the round of 16, it’s worth noting Galatasaray (110.1) have a near identical figure to Slot’s men. At the other end of the standings, one wonders if Klopp has done some consultancy coaching with Bodø/Glimt.

Going through each game allows us to see how Liverpool have compared to their opponents in each match. The Reds covered less distance every time. However, the average difference was only 3.4km, about 300m per man, with a maximum of 6.0 against Atlético Madrid and Eintracht Frankfurt.
Five of the teams posted a figure against Liverpool that was higher than their season-wide average for the Champions League too. PSV were not one of them and won 4-1, again showing that while this info can be interesting, running further doesn’t automatically lead to winning more.
The Reds didn’t get close to 120km in any game either. Sorry, Jürgen.
It makes sense that the teams are reasonably evenly matched, what with them essentially following each other around the pitch. It would be fascinating to see what the margin would be if the Reds faced Bodø/Glimt, the distance kings. The knockout phase draw means that can’t happen until the final (yes please).
The Norwegian side have the top three players for total distance, though of course they have played more games than some teams. Inter Milan midfielder Petar Sučić tops the per 90 minutes rankings on 12.9km, with Phil Foden and Mikel Merino (in joint-seventh with 12.2km) the leading Premier League representatives.

The other English clubs are led by Florian Wirtz (11.9km), Sandro Tonali (11.6km), Xavi Simons (11.3km) and Enzo Fernández (11.1km). Despite Liverpool’s relative lack of distance covered as a team, Alexis Mac Allister (11.5) is in amongst these leaders. No Chelsea player is ahead of Dominik Szoboszlai (11.1), with Hugo Ekitike (11.0) just behind the Hungarian.
Fotmob’s published standings only include players with at least 450 minutes in the competition though. Compiling the numbers match-by-match reveals that Curtis Jones has averaged 11.6km per 90, with Alexander Isak (11.1) a touch ahead of Ekitike (albeit from a sample size of less than half the size).
It might surprise you to learn the highest figure in a single match by a Liverpool player was logged by Alexis Mac Allister in the San Siro: 12.2km. While distance doesn’t equate to speed (without time, maths fans), there may be life remaining in the legs of a man who has looked off the pace this term.
As the opponent and state of play can dictate how much distance needs to be covered, it may be more interesting to look at the percentage of the Reds’ total for which a single player is responsible. By this measure, Wirtz takes silver and gold.
If we included opposition players for their teams, the top nine of this chart would include Aurélien Tchouaméni (10.7 per cent), Hugo Larsson (10.6) and Jude Bellingham (10.5). It’s fascinating to ponder what the current configuration of the Liverpool midfield would be had the club managed to sign the first or last or both members of that trio as they hoped.
Galatasaray’s top trio, whether by total distance or proportion of team total, were all Premier League veterans. Hopefully Lucas Torreira, Mario Lemina and Davinson Sánchez will be forced into similar shifts on Tuesday. But before that, we’ll be taking a look at the sprint data. Distance is one thing, intensity another.
Have you ever wondered about this sort of thing? I've been asked about it loads of time on Twitter over the years. I'm not convinced it tells us too much but it's worth writing about given the data hasn't been available before.
Any questions on the data? Fire away!