
Liverpool have a safer Danger Zone than Manchester City
CIES posted shots allowed stats for the danger zone of the penalty box. Liverpool and Manchester City are neck and neck until further vital context is added.
Data can be sliced up in all manner of ways. If you want a list of players who’ve scored a Premier League hattrick on a Tuesday, you can get it. What use it is to you is another matter.
A better away to assess many football statistics is to factor in where on the pitch the action takes place. While a data analyst might love Mario Balotelli’s shot volume, the fact many of his efforts were hit from a different postcode to the goal undermines the findings.
The most important section of the pitch is known as the danger zone, the central section of the penalty area which stretches from the six yard box out to the 18-yard line. CIES Football Observatory recently shared the data for shots taken and allowed in this prime football real estate. At the back end of the pitch, Liverpool are the best team in England this season, as shown by this table which is sorted by danger zone shots conceded per match in 2024/25.

The gap from the Reds to Manchester City is negligible. It’s interesting that the Premier League top two are outside the leading 10 for Europe’s big five leagues, with Aston Villa and Nottingham Forest joint-24th. Is it harder to defend in the Premier League? Is it more competitive, with fewer terrible sides? It’s richer, which always helps when building an attack.
With this being a niche statistic that is not widely shared, it is impossible to compare across seasons. It is worth applying further context to the available data, though. We might have narrowed shots down to the most valuable part of the pitch, but the above data does not account for the quality of the chances within the danger zone. From Liverpool’s perspective, a deeper dig is hugely rewarding.
Differences in coding by data providers makes this an impossible metric to assess with certainty. The Reds’ rate of 3.09 danger zone shots allowed per match equates to 34 for the season. Reviewing the shot maps on Understat brought up 45 for Liverpool, with a cross check on Stats Zone possibly eliminating six of them due to appearing outside the centre of the box on their shot graphics.
Take those out, ignore set plays, whatever: there’s no obvious way to reach 34. City also have 45 (rather than 35 as implied by CIES), though, so we do at least have an equal sample for comparative purposes. Here’s a very low budget graphic of the danger zone shots Liverpool have conceded, according to Understat.
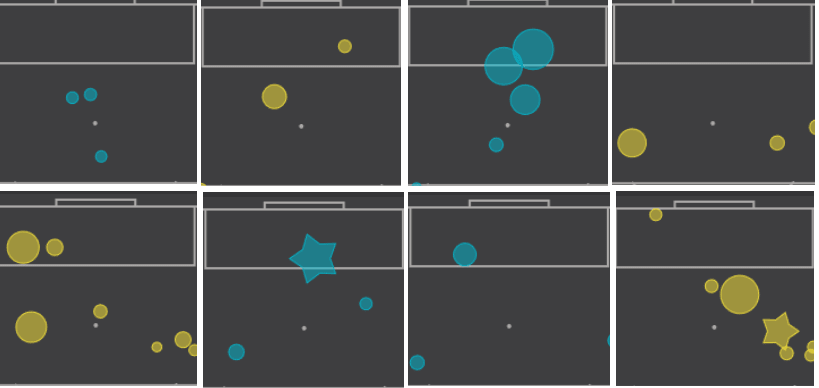
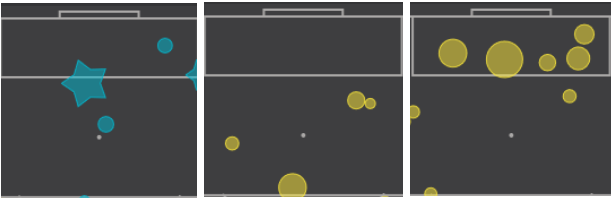
Can you see Orion, or Canis Major? I have no idea what I’m talking about when it comes to constellations, so probably not. There are lots of sections of the sky which aren’t very cluttered, with a few which look slightly concerning.
Again, context matters. The three big blobs in game three occurred at Old Trafford when Liverpool were 3-0 up. The blue star at Wolves, in match six, was down to a defensive error, otherwise there was little to be concerned about at Molineux. The worst threat from Brentford and Aston Villa - games two and 11 - was set piece based, one area in which the Reds do need to improve. The important thing remains that they’re not being sliced apart in open play when games are on the line.
This can be proven further with more statistics. The total of open play crosses and passes which the Reds allow into their box has only dropped by 0.07 per match since last season. However, the proportion of them from crosses has gone from 16 per cent to 21, making some of the deliveries easier to defend.
Ibrahima Konaté is only seven short of his clearances tally from the entirety of 2023/24, while Virgil van Dijk has seen an 11 per cent uptick in the proportion of his that are dealt with by his magnificent head. Their combined prowess makes it very difficult for teams to score against Liverpool from aerial crosses in open play and the Reds’ structure is leading them to attack that way more often.
The more solid centre they are facing leaves opposing sides struggling to test the Reds’ goalkeeper in open play. Liverpool are allowing just 0.82 shots on target per 90 minutes from the danger zone once set plays are excluded, possibly 0.64 if we discount the six shots with the questionable location.
This stuff really matters. An non-big chance shot on target in the danger zone is converted 28 per cent of the time, 11 points above similar value efforts from the wider areas of the penalty area.
Factoring this in along with the expected goal values of the chances allowed shows that Liverpool are far further ahead of City than the CIES numbers imply. On the below graph, lower numbers are better.
By being ahead on shots, Liverpool obviously then have an immediate advantage for the other metrics shown here. Equally, a team could be allowing more efforts which are of lower value, but that isn’t the case. City’s xG per shot is creeping up towards big chance territory.
There is a simpler way to frame the issue which must be haunting Pep Guardiola at present. In their defeats to Bournemouth and Brighton, the defending champions conceded chances collectively worth 4.93 expected goals in the danger zone in open play (pictured below). Liverpool have allowed 4.76 in total this season, possibly 4.42 if the six potential exclusions are deducted.
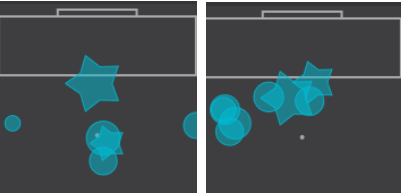
This is a constellation for all Liverpool supporters to enjoy. Something similar appearing on the pitch in the City box at Anfield on December 1st could prove hugely important to the 2024/25 title race.
https://youtu.be/d3D7Y_ycSms?si=CNFsrIl1zBaa2Q6m
This is what aggravates me with a lot of the commentators we get on the US broadcasts. They keep talking about threat and chances and defensive breakdowns and I'm looking at the data both during the match and after and not really seeing much of anything, especially when it comes to genuine chances (aka shots with some measure of xG.) But then that becomes the narrative and by the next week, the NBC studio is talking about Liverpool's "suspect defense" and I'm all: "Are you people actually watching the same matches that I am or is this just coming from your producer as something to fill airtime with?"
Yeah, you can “feel” this while watching. Against Brighton, you could feel City giving away another chance. In our matches, we “could” giveaway a goal but it never feels like that is likely to happen