
Liverpool's Expected Threat Shows What They're Missing
Or more accurately, who they're missing
The review of the Bournemouth match mentioned expected threat. As it’s a metric that hasn’t been covered on this newsletter before, it’s time to dig into Liverpool’s xT.
Expected threat sounds ominous. In the real world, it is. Especially at the moment. In football, it’s “the measure of scoring opportunities created via passes and crosses. Calculated based on start/end locations of non-shot events,” according to the MarkStats website.
It’s a way to assess a team or individual’s build-up play. We get an idea of how much they should create in expected goal terms, providing us the opportunity to compare the xT and xG figures. We can also assess the balance between attack and defence.
At Bournemouth, Liverpool generated a high expected threat without producing much of significant value in shot terms. The map of their successful final third passes illustrates this, with very few of the 204 recorded resulting in chances created in good areas (as denoted by the lighter blue arrows).
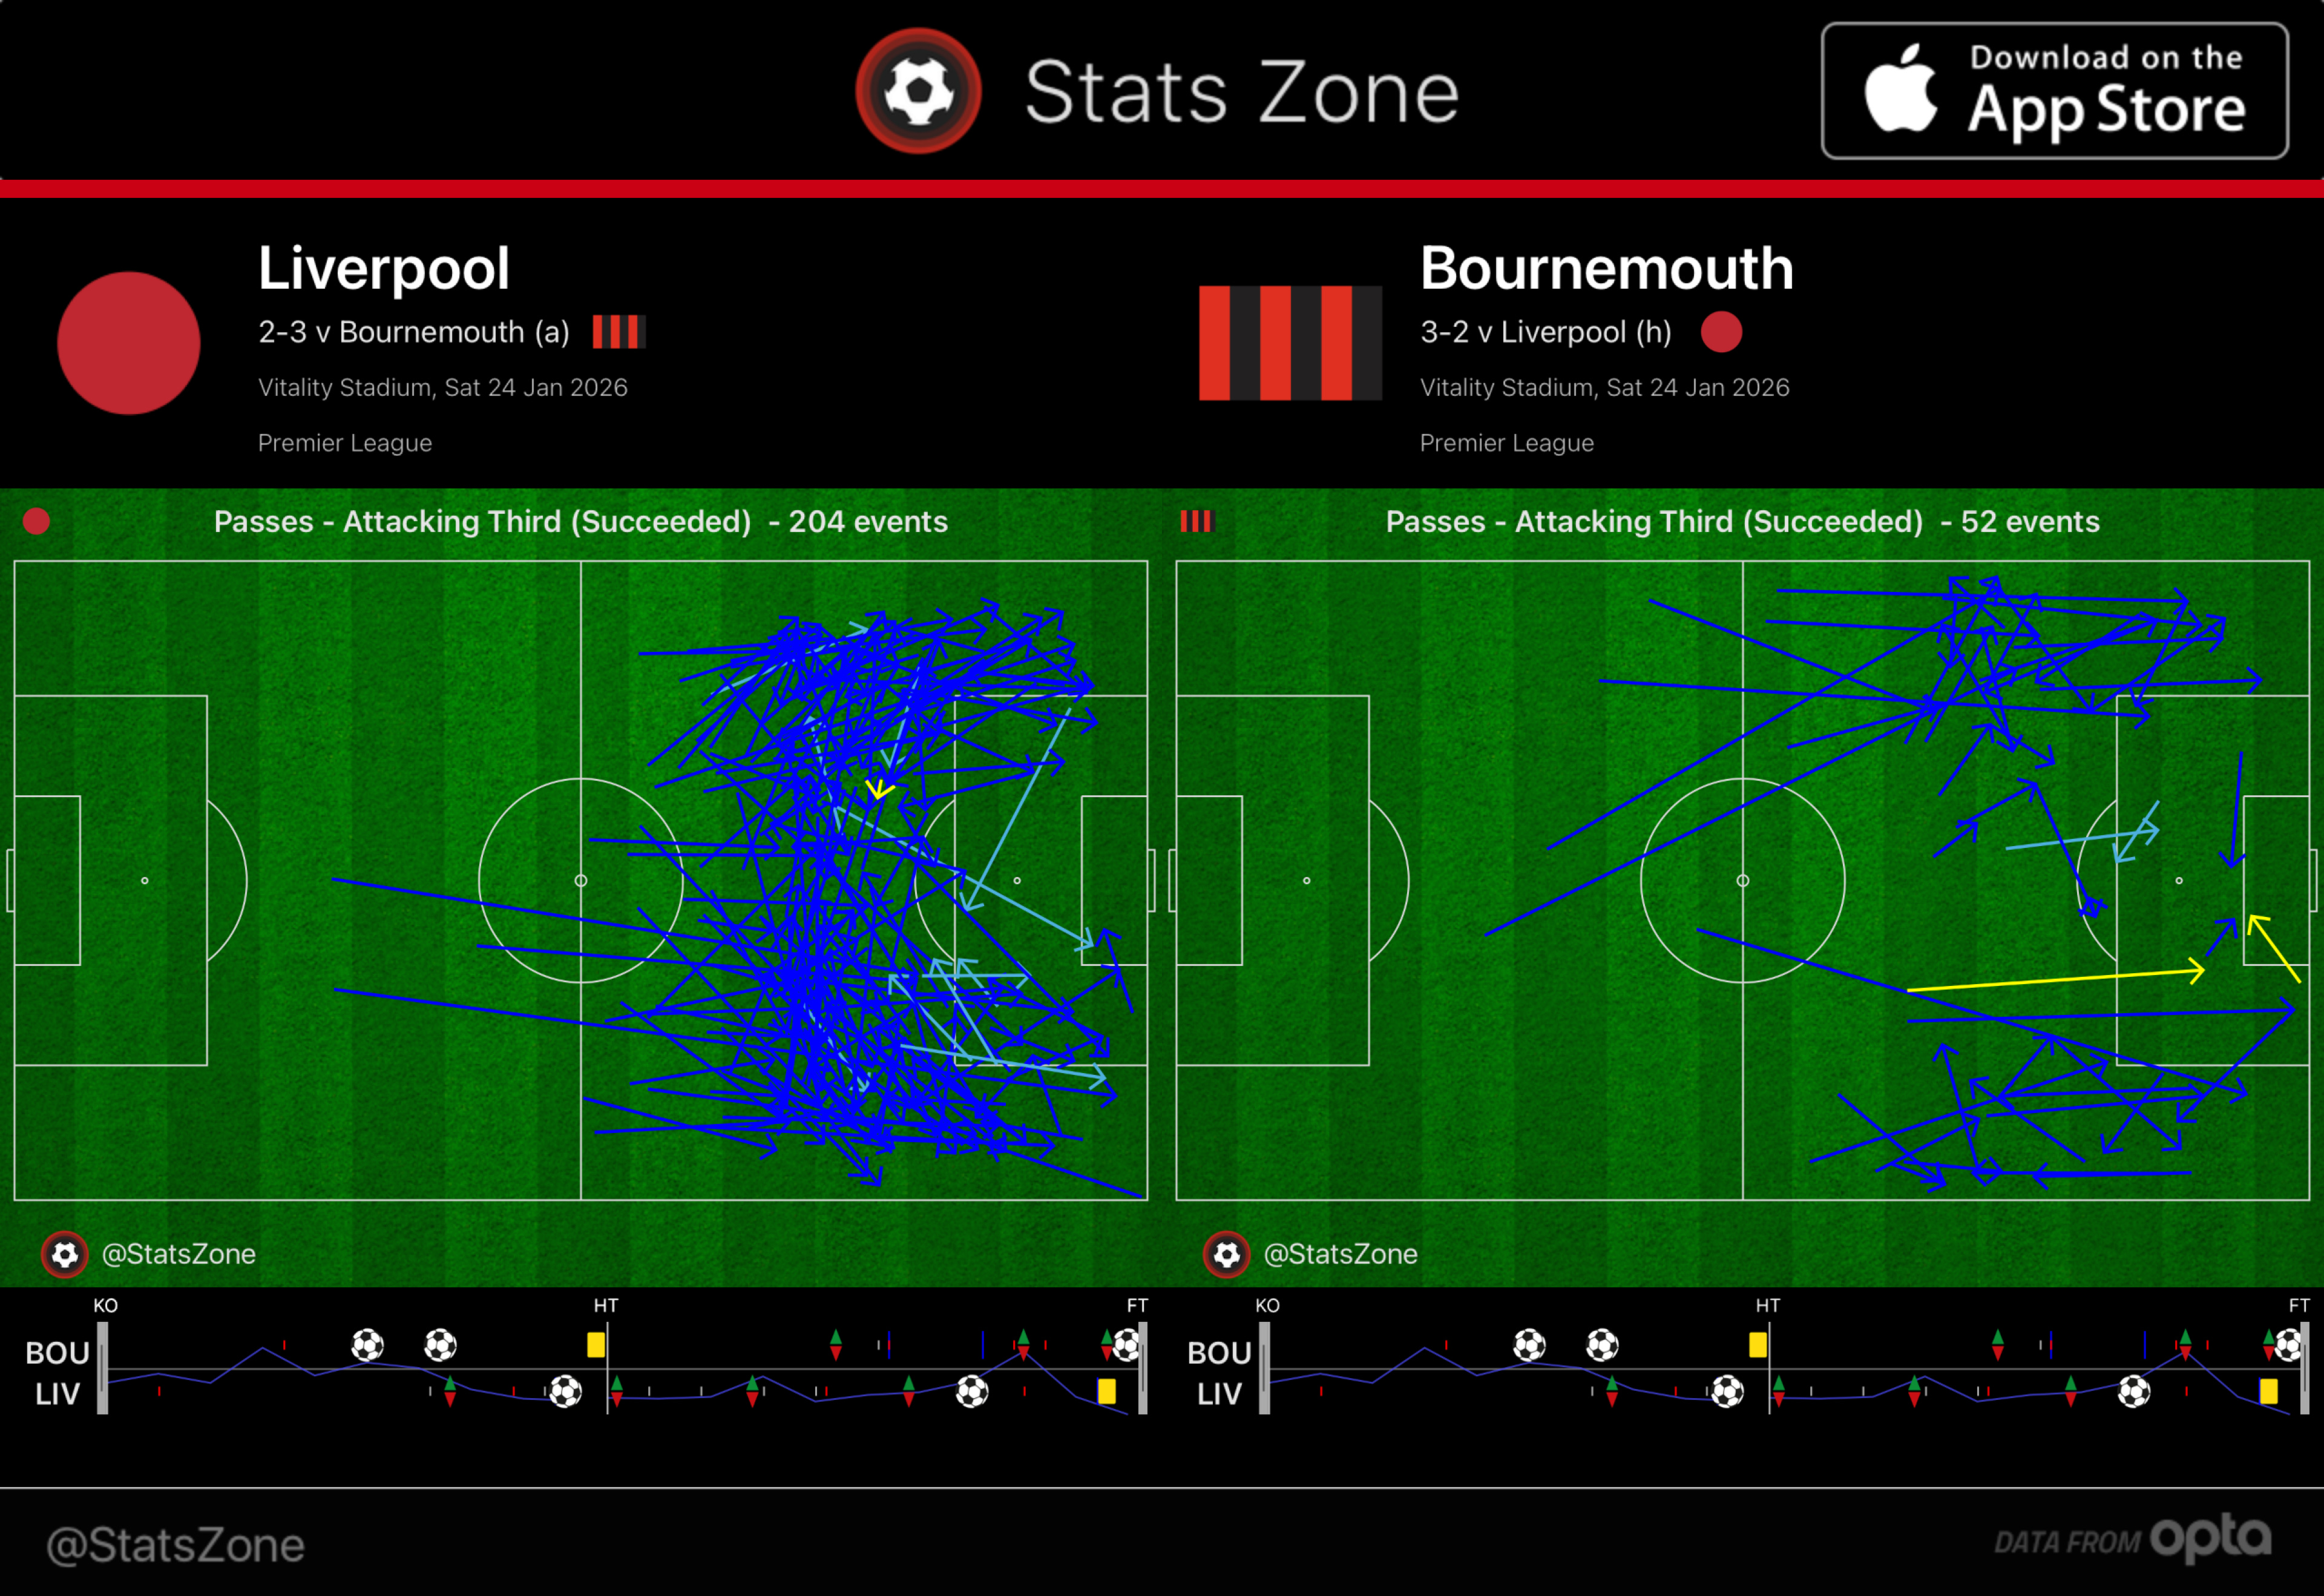
Bournemouth delivered as many key passes in the danger zone as the Reds from a quarter as many in the attacking third (with yellow arrows representing assists). Their defensive line - the average distance from a team's goal to where its defensive actions occur - was the deepest Liverpool have faced in the Premier League or Europe this season. The Cherries were almost 15 meters deeper than their average, earning the right to do that by going 2-0 up.
The Reds were held at bay relatively easily. Expected threat doesn’t count for much without creating chances. The issue for Arne Slot is that Liverpool’s xT is lower than in past seasons, with the defensive number not sufficiently impressive to overcome that.
This needn’t be disastrous. The figures for 2025/26 aren’t miles adrift of what Liverpool achieved in their title-winning campaigns. It’s the difference between these numbers and their expected goal equivalents that looks alarming.
The little they offered up front at Bournemouth combined with conceding a hefty xG total from relatively few opposition passes made it Liverpool’s worst match of the campaign for expected goals against expected threat.
They wasted 1.31 xT in attack and conceded 1.20 xG above it at the back. While we’ll mainly focus on the Premier League, the only other match to get vaguely close to a combined -2.51 deficit was the loss to PSV Eindhoven (-2.29), although they had a penalty. As did Galatasaray in the next worst example (-1.81).
Bournemouth really was an outlier by these measures. That doesn’t mean it isn’t also part of a wider, problematic trend. Liverpool are generating fewer expected goals than their expected threat suggests they should (by 0.07 per match) while also allowing 0.19 above the xT at the back in xG.
In the previous three Premier League seasons there were 10 teams who failed in this way at both ends. None of them finished above 10th, with 14.7 being their average position. Liverpool have a much better xT difference than any of them, but it may help explain the struggles the Reds are enduring.
Slot has tried to address the problems. The cumulative expected threat difference has improved since tightening up after the Nottingham Forest defeat, albeit the margin wasn’t that wide just two matches ago.
As encouraging as this seems, it doesn’t account for the difference between xT and xG. Here’s the same chart with those figures, which shows how Liverpool have struggled to stay in credit for xG minus xT all season no matter how they have played.
Bettering expected threat with expected goals has had far more impact at the defensive end. In the 10 league games in which xGA was below xTA, the Reds accumulated six wins and four draws, conceding just five goals. Liverpool’s five Champions League victories all saw a lower expected goal figure for their opposition than expected threat suggested too.
Generating an advantage in attack has proven less decisive towards results. Liverpool can often afford to underperform xT a little to still generate a decent amount of xG. The problem is when a little shortfall becomes a big one, as we saw at the Vitality Stadium.
The offensive end of the equation remains the greater concern. This chart shows how the players’ passing xT has changed since last season, including a comparison with their former club where appropriate. You will see that most players are at roughly the same level.
This one facet of play makes a strong case for why Curtis Jones should be in the team ahead of Alexis Mac Allister, particularly as passing is the latter’s strength. It’s a surprise to see Conor Bradley ahead of Jeremie Frimpong in light of the Netherlands international’s recent form. He has at least maintained his Leverkusen form, which is a decent starting point.
So far, so similar to last season. It means that the downturn in xT since 2024/25 can be explained almost entirely by the Trent Alexander-Arnold factor. With 0.19 passing expected threat per 90 minutes, the Liverpool right-back was second only to Kevin De Bruyne (0.20) on this metric in England last term.
If you wanted better than Trent from the rest of the big leagues, you’re looking at Luka Modric, Pedri, Nadiem Amiri (who?), Joshua Kimmich, Ismaël Bennacer, Michael Olise (FAO Richard Hughes) and Rayan Cherki. That’s not a long list of realistic transfer options for Liverpool.
The Reds’ xT deficit from 2024/25 doesn’t solely reside in Madrid. Kostas Tsimikas (0.13) outperformed every other full-back at the club either last season or this, with Luis Díaz (0.10) only behind Mohamed Salah in the front line in Slot’s debut year. Florian Wirtz can’t replace all of this on his own, as good an xT acquisition as he is. The summer business made Liverpool less threatening.
It’s no surprise Liverpool’s build-up play has suffered with the departure of Alexander-Arnold. That isn’t even the main issue, though. Hughes’ task is to get more threat into the team. And never mind the #66, getting the xG above the xT has to be priority #1 for Slot.
If you’re interested in a full explanation of expected threat, here’s the article that explains the model that is the basis for the MarkStats data.
The 'Jones in for Mac Allister please, Arne' bandwagon gains momentum here!
Great analysis. I wonder if the discrepancy between xG and xT for Liverpool would also be impacted by the limitations of xT, mainly that it doesn’t account for the positioning of opponents (mainly low blocks against Liverpool) and if the player is under pressure. Also, xT rewards progressive play over possession, so a risky pass has a high value, but risk in buildup goes against Slot’s current approach.