
Liverpool's Player Trading Highlights Transfer Strategy
CIES shared data on clubs' profit and losses from players who were bought and later sold. It reveals a lot about Liverpool's transfer strategy.
We are accustomed to seeing transfer business defined by net spend. It’s better than looking purely at gross outlay, less accurate than accounting for inflation as per Paul Tomkins and Graeme Riley’s Transfer Price Index (TPI). It provides a reasonable snapshot of what a club has invested over a certain period.
As has been discussed on this site in the past, any measure of transfers doesn’t tell even half of the financial story anyway. Liverpool have a net spend of €298.4M since 2020, little more than a third of the €830.3M that has been shelled out on salaries in that period. The club’s owners FSG are routinely criticised for not investing more in the transfer market yet it’s the much larger wage bill which keeps the elite players in red once they’re on board.
There remain interesting ways of assessing net spend. CIES Football Observatory recently published data which looked at how clubs have performed in terms of player trading since 2015. They took the outlay and income relating only to footballers who both joined and left a club in the previous nine years. In theory, it highlights who operates best at what is the aim for the vast majority of teams: buy low, sell high. Did anyone mention Moneyball yet?
While CIES did not publish the data for all teams across the world, they gave us the top and bottom 50 clubs for this brand of net spend. The statistics highlight the money in English football, not that anyone needs reminding, as there are 20 teams from the country in the 100 shared, with Italy (13) and France (12) next in line. Most notable is that 17 of the 20 were on the deficit side of the ledger, with only three in the profit sample.
This chart beautifully highlights the difficulty of competing in the Premier League. The data also tells an interesting story about Liverpool.
While there are 20 English teams in the study, they are not all currently in the top flight; four are in the Championship, Huddersfield lower still. Another five are current Premier League sides who were relegated from the division and returned within the last nine seasons.
Ignoring the long established top flight clubs leaves Brentford and Brighton as the two who have recently reached the top level for the first time in the modern era and managed to stay there. It’s not coincidence that they are two of the three English sides in the data who are in profit, as they are renowned for being smartly run operations.
You have likely noticed there is no sign of Manchester City, whose player trading since 2015 must therefore fall between the €74m profit and €-37m deficit edges of the two halves of the data. The accuracy of their figure is perhaps for the ongoing Premier League investigation into their finances to determine.
This player trading measure of business is an ever evolving state of affairs, with each transfer window impacting the figures for a given period. Per LFCHistory, 11 of Liverpool’s 15 most expensive signings of all time are currently in Arne Slot’s squad, so are exempt from the CIES data, while Andy Carroll joined, didn’t do much, then left prior to the period in question.
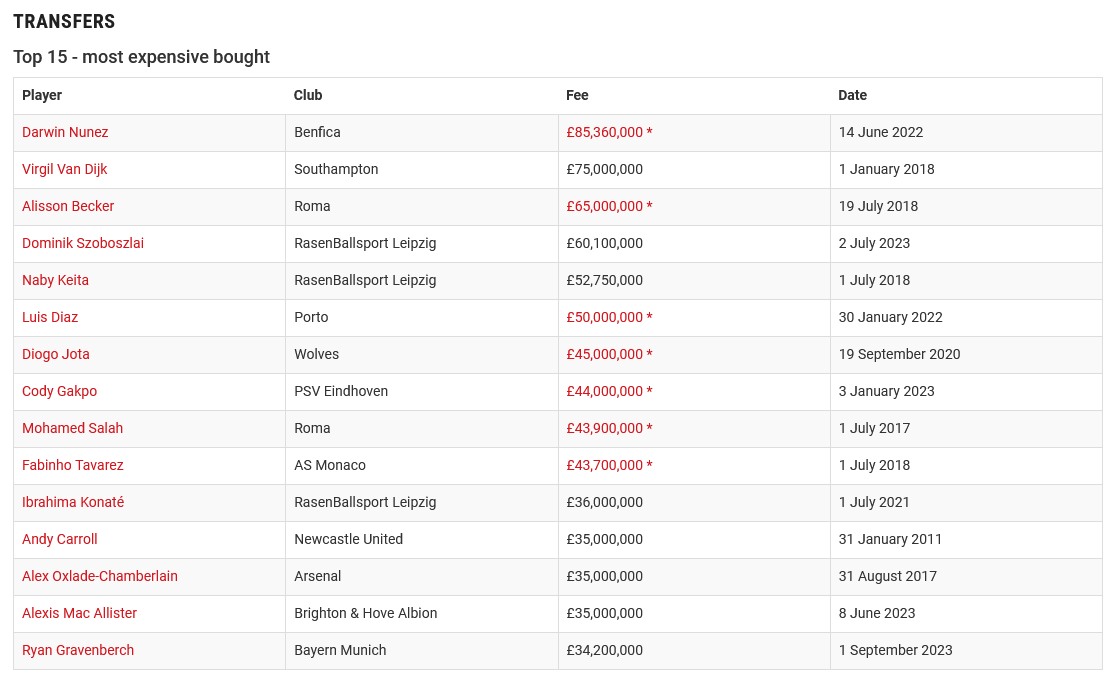
This could soon change. Virgil van Dijk (who is second in the standings) and Mohamed Salah (ninth) could both leave for nothing next summer. There is growing talk among supporters that this could be Darwin Núñez’s final season with the Reds too. His exit would result in a loss on his club record transfer fee if that proves to be the case.
The three men on the above list who both joined and left since 2015 illustrate the approach Liverpool tends to employ with the players they sign. Naby Keïta and Alex Oxlade-Chamberlain departed on free transfers at the conclusion of their contracts, a fate Fabinho was likely heading for prior to Al-Ittihad bailing the Reds out.
As great as the Brazilian once was, he had three years remaining on his deal following a poor 2022/23 campaign, so could easily have still been at the club next season. To be able to make a raw figure profit in those circumstances - never mind a gain in the accounts following amortisation - was a remarkable slice of good fortune.
As CIES only provided an overview, it seemed worthwhile looking closely at Liverpool’s trading history. Using Transfermarkt’s data inevitably arrives at a slightly different net figure to CIES (€146.9M versus €124M) but it gives a flavour of the financial ins and outs.
The list comprises 26 players. Six of them both joined and left on free transfers, with that group a mixture of legends (Joël Matip, James Milner) and third choice goalkeepers (Adrián, Ádám Bogdán, Andy Lonergan and Alex Manninger). The latter four all begin with A, if any Only Connect question writers are wishing to torture future contestants.
That leaves us with a score of eligible players who left an impact on the books beyond wages. Here they are, sorted by the net difference between their purchase and sale prices.
The broad trend is very clear. At the top we have players who contributed little of note to the team but did at least raise funds when leaving, most of whom were sold when Michael Edwards was involved with the club. Down at the bottom we find several key players whose worth was delivered on the pitch rather than in the trading data. The 14 players who left for fees collectively made a profit of €59.3M, even though five left for a loss.
Even a club with an intelligent decision making process like Liverpool falls foul of the inherent risk in the transfer market at times. Sizeable funds were invested in Thiago Alcántara, Keïta and Oxlade-Chamberlain, only for them to suffer too many injuries to make sustained, high-value impacts. “What [Ian] Graham saw on his laptop was a phenomenon,” is a famous line regarding the scouting of ‘Naby lad’, but he recorded what must be the biggest loss by this measure the club has ever seen.
It could be worse, as CIES noted in their article. “Two English teams also totalled a deficit in excess of €500 million: Manchester United (-€584m, maximum loss of €110m for Paul Pogba) and Chelsea (-€580m, maximum loss of €70m for Romelu Lukaku). Even Keïta made a greater contribution to top trophies than those players. While no team is perfect, Liverpool should remain one of the smartest operators in the Premier League for the foreseeable future with this strategy in place.
Thanks Beez. That chart of player trades (blue arrows) is brilliant. The sell on clause, for the odd Solanke-type, may bring in future income too.
What is incredibly impressive is this list of players:
- Kelleher
- Bradley
- Gomez
- Trent
- Quansah
- Nyoni
- Jones
- Elliott
- Morton
- Doak
The list is of first team players. Morton and Nyoni are on the fringe. I assume Doak will be next in the first team of those out on loan. Then we have McConnell, Danns, etc. All represent future sales potential, which is another interesting metric considering the sales we achieved for Solanke, Sepp, etc. As much as the big player trades underpin the big numbers its that investment in young talent, where we're a top-top side, that sets us apart.
It has been a remarkable success despite Trent likely leaving for free. But what we've got out of him has been the equivalent of signing an elite talent for say £30m in 2017 and paying a top wage for the past eight seasons. What an incredible player, and saving, he has been for Liverpool.