
No Passengers: How Arne Slot's Liverpool 'Kill them with Passes'
Liverpool's passing value has shifted since last season. They're arguably making more from less thanks to carrying no passengers.

Passes come in all shapes and sizes. Lengths, locations, pressured, directions. What is measured can vary quite a lot.
As with shots, assigning a value helps. You’re lucky if a week goes by without a pundit voicing their opinion that pass success rate means nothing and that they’d love to know more about the types of passes involved. An analyst will agree with them on the former while doubting their commitment to learning about the latter.
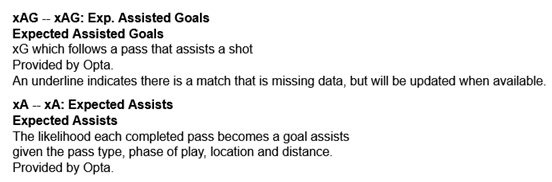
The data can be confusing even for those of us with an unhealthy interest in it. For years, expected assists was the term given to passes which create chances. If a player set up a shot with an xG value of 0.1, that’s how many expected assists were added to their ledger. Then FBRef blurred the lines a little.
The aforementioned metric was traditionally shortened to xA, but FBRef now use this (and the full version of the name) for a passing model, which rates the likelihood of any pass becoming an assist. They use Expected Assisted Goals (xAG) for what nerds used to call expected assists. If you’re now asleep, I can’t blame you.
If you’re still conscious you might be interested in what I’ve been thinking about lately, namely the difference between the figures for the two metrics and the importance of xA to Arne Slot’s Liverpool. ‘Kill them with passes’ was an instruction heard on the training ground in pre-season, as the Reds’ new coaches began instilling a method of play a few degrees of separation from Jürgen Klopp’s more hectic style.
It has been a fascinating evolution. Liverpool’s xA per match is down on last season, but their rate for xA per 100 passes has never been higher. They’ve increased the value of their passing while playing a little more patiently with a lower possession average.
Any method is potentially valid. The above chart doesn’t suggest the 2019/20 team were anything special when we know otherwise. However, the data gets more interesting once we compare it with the back of the pitch, look at how much is being added for xAG and the difference between the two metrics for the players.
The Reds of 2024/25 allow their opponents 0.18 xA per 100 passes. Lower than in the previous three campaigns, Liverpool have had better seasons for this stat in the past. They have never had a better balance between the two though.
Only two Premier League teams in these eight seasons have been above 0.11 difference for xA per 100 passes. Their identity highlights variety in approach better than almost anything else.
First, we have the Arsenal of last season (0.16). They had a very strong process for build up which helped make them hard to hurt going the other way. Statistics like this are why many people thought they might win the league this term. I did, and I’m delighted to be wrong.
The only other team better than present day Liverpool has to be Manchester City, right? No, it’s a side that can make a decent case to be the exact opposite of them. Ladies and gentlemen, I give you Cardiff City in 2018/19 (0.14).
Proper football men, Sol Bamba, Neil Warnock; the whole package. A super direct side like Cardiff will create an outsized amount of threat per 100 passes because they don’t bother with that tikka takka tarka the otter muck, mate. Get it forward. Now.
You almost wonder why more teams don’t take this approach. Here’s why: the Bluebirds’ xAG was little above half of what Arsenal produced last season. Slot’s Liverpool are - on a per game basis - better still, with only a quintet of former Reds and City sides above them.
And that’s the whole purpose of the venture. Passing without penetration is pointless. Welcome to my coaching seminar, we’ll start with the Three Ps.
Liverpool are adding 0.22 xAG to their xA figure per game this season. It’s a shade up on 2023/24, for their widest margin since the summer of 2017. An already strong build-up is having a decent dose of magic sprinkled on top.
Again, having a negative figure didn’t hurt the 97-point Reds of six years ago. Equally, there’s clearly no harm in creating better chances than what a pass model believes your team should.
It won’t be news to hear Mohamed Salah is the magician extraordinaire among the regular starters this term, having added 0.13 to his xA per 90 minutes. Harvey Elliott’s 0.22 uplift shows how creative he has been when given the chance, which some would argue has not occurred often enough.
Here are the figures for the players with over 900 minutes this season. It’s a good way of showing who is or isn’t delivering what is expected of them creatively based on the passes they are completing. The bottom of the chart is particularly striking.
Even the players who are below par are so close to it as to make the difference irrelevant. You wouldn’t expect much creativity out of two or three of them either, thanks to where they play.
Each of the preceding seven seasons saw Liverpool carry at least four players - an average of 5.4 - who were below the bottom man on the above chart. As in 2024/25, many of them were defenders or holding midfielders. There were plenty of more forward thinking players, though, including Elliott, Curtis Jones, Naby Keïta (all twice), Alex Oxlade-Chamberlain and Xherdan Shaqiri. Oh, and Salah, in 2020/21.
But this season? No passengers. Or, at least, no players delivering markedly less than the pass model suggests they should. The Reds of Slot have one of the best xAG figures in the Premier League’s advanced data era precisely because they carry no fat.
They’re a lean, mean passing machine, moving the ball efficiently to create chances at better than the expected rate. Imagine what they’ll be like with a pre-season free of international tournaments and some recruitment fitting the current head coach’s ideals rather than those of his predecessor.
Killing with passes isn’t completing hundreds for the sake of it. It’s providing a platform for your creative players while trying to deny your opponents a similar base. Liverpool are doing this at very healthy levels indeed.
Maybe the pattern I’ve stumbled across is random - there’s only so intentional any plan can be - but it’s good that Liverpool’s numbers are on the up, whatever the explanation.