Roy vs Kenny: 20 Game Comparison
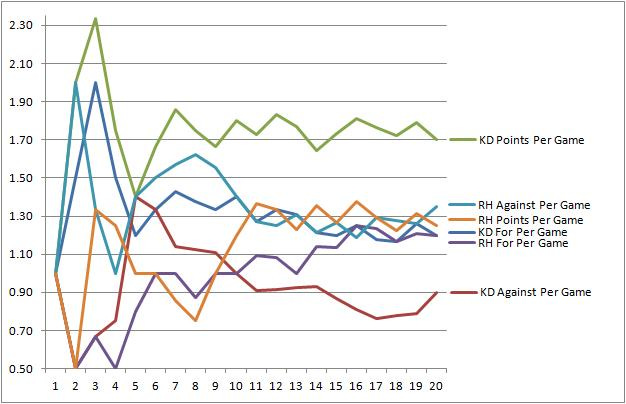
Following a request on Twitter for this information, below is a graph showing the vital three statistics for Liverpool's first twenty league games in the last two seasons: goals for, goals against, and points won, all measured on a per-game basis.
Twenty league games was the full extent of Roy Hodgson's tenure in the Anfield hotseat, hence why that is the length of time studied here in order to compare it with Kenny Dalglish's first full season in charge.

It's no surprise to see that Dalglish is comfortably leading in both the points-per-game and against-per-game measures, but I was surprised to see that for-per-game is exactly the same for both managers after twenty matches; even allowing for Liverpool's woes in front of goal this season, I had assumed that Kenny's team would have outperformed Roy's in goalscoring, but it seems that their better defensive record has enabled this season's team to outperform last season's on points.
I should also point out that the generally poor results in the six further games that Liverpool have played this season have lead to all three of the statistics worsening than is shown here, with goals-per-game now below the figure posted by Hodgson at the end of his tenure (1.15 vs 1.20). However, with a .25 points-per-game lead, Kenny would still outperform Roy by 9.5 points across a whole season if extrapolated.
Is that good enough considering the £20m or so extra net investment Dalglish received over Hodgson? Ultimately, if Liverpool miss out on the top four as looks likely, then perhaps not. I'm sure the hordes on Twitter will have an opinion to share on this...
Please take a look at my other articles, a list of which can be found here.
