Shot Difference and Goal Efficiency
There have been numerous articles this season, both on this site and elsewhere, pointing out how poor Liverpool's shot conversion has been this season; indeed, at the time of writing, the Reds lie dead last in the division for this statistic, with a meagre 9.0% of their shots finding the back of the net.
I have previously covered here how Liverpool have been dominating their opponents in the majority of league games this season, but I have now devised some further (admittedly simplistic) measurements to assess how much control all of the Premier League teams have had over their matches.
It seems logical to me that if you have more shots than your opponents, then you can be considered to have controlled a game, as you have been on the offensive more often than they have; whilst there can be exceptions to this on an individual match basis, I think that by looking at the figures for the entire season most anomalies should be ironed out.
It doesn't mean that you are the most effective team of course, as goals for and against will always determine that, but it should give a simple indication whether a team is doing a lot of things right or not. Here are the figures for shot difference for the Premier League season so far:

It's interesting to note that only seven of the twenty teams have had more shots than they have conceded, and also that high-flying Newcastle United (currently fifth in the table at the time of writing) are not one of them, but more on that shortly.
From a Liverpool perspective, it's very encouraging to see them third in the table. I'm not suggesting this measure is the be-all-and-end-all; most people would laugh at the notion that Liverpool have had better control of their matches than likely league champions Manchester United after all. But to have had more shots and given away less shots than them certainly offers some encouragement on how the team has played overall this season.
As I mentioned earlier, how many goals a team scores and concedes will always be the most important factors on a team's season, and so I have created a simple 'goal efficiency' metric.
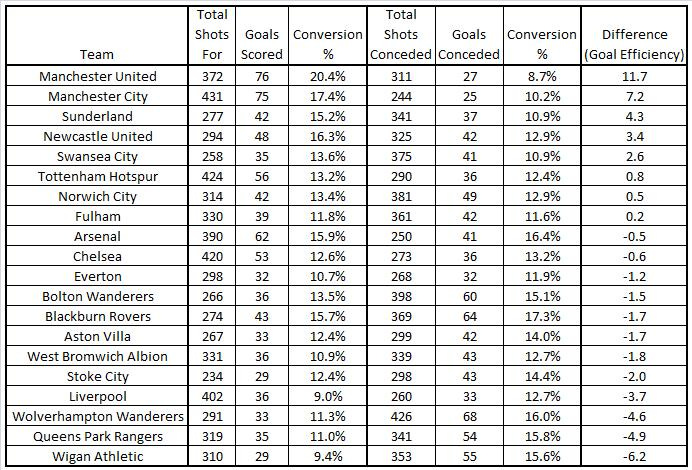
To be successful, a football team needs to score as many of their shots as possible, whilst conceding as low a percentage of the opposition's attempts on goals as possible. Therefore, by looking at the difference between the two conversion percentages, we can see how efficient a team has been at both ends of the pitch using one figure. The table below contains these figures, and helps to explain why certain teams appear to have over- or under-achieved in the league this season:

Whilst Liverpool are an encouraging joint eighth for opposition conversion percentage this season, their woes at the other end of the pitch have given them a very disappointing goal efficiency of -3.7, and seventeenth place in the Premier League by this measure. They are also the only team in the top-half of the actual league table who appear in the bottom-half here. Whilst not as inefficient as Liverpool, the table also demonstrates why Chelsea and Arsenal have had relatively poor seasons by their own high standards.
The table also illustrates why the likes of Sunderland, Newcastle and Swansea are on course to over-achieve their expected league finishes this season; all three teams have had less shots than Liverpool, and given more away to their opponents too, yet the conversion percentages are more in their favour and so they have reaped the benefits point-wise.
If Liverpool had maintained their shot conversion percentage from the previous three seasons (13.5%), then they'd have scored eighteen more goals at this point, and also be joint eighth in the above table with a goal efficiency of 0.8%. Obviously they'd be higher in the real table too, so whilst they have been far too open in central midfield at times this season which has allowed opposing teams more space to shoot, the poor form demonstrated by Suárez, Carroll and co. appears to have damaged them far more.
Whilst signing a lethal, dead-eyed striker wouldn't solve all of the problems the Reds are having on the pitch, it certainly seems that it would go a long way to improving the team's results and league position. Here's to a more efficient Liverpool team in 2012/13.
Statistics sourced from EPLIndex. Please take a look at my other articles, a list of which can be found here.
