
Walk, Jog or Sprint: The Distance Covered Debate
Covering distance only seems to matter when you lose, not when you win.
Liverpool won the first Merseyside derby at the Hill Dickenson Stadium in dramatic circumstances. Having dropped two points in stoppage time in their final match at Goodison, the Reds picked them back up in the 100th minute on Sunday.
They have far greater need for the points this season too. Their victory was made all the more remarkable by the fact that Everton covered more distance than the Reds during the game.
What? You didn’t hear about that? I didn’t think so. Why would you? Physical data only ever seems to get aired in relation to Liverpool when they are outrun in their defeats, regardless of how relevant or not the kilometres they covered are to the outcome of the game.
The physical data should not be dismissed entirely. A recent Bluesky post by Reds fan Dan Kennett showed there has been some correlation between the extent to which Liverpool’s opponents have logged more distance and their results this season.
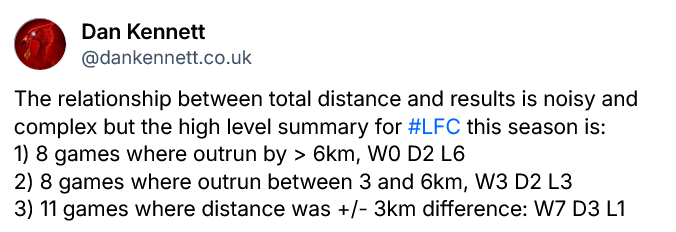
With timing that can chop down any statto (trust me), the Reds then won their next league match against Fulham despite Marco Silva’s men covering 7.43km more of the Anfield turf than they did. The distance numbers that both teams ran in that game were near identical to those in Liverpool’s preceding Premier League match, a limp defeat at Brighton.
Even the word ‘ran’ is somewhat misguided when the data is broken down into walking, jogging and sprinting. Does it matter that a team has a higher distance covered if most of the difference was conducted at walking pace?
Ask Everton; 2.57 of the extra 2.69 kilometres they covered at the Hill Dickenson Stadium was at the lowest speed setting. Most of that was probably spent trudging back towards the halfway line after Liverpool scored.
So, what does affect how much ground a team covers? What is the impact? Put your trainers on. Pop a calculator in your pocket. It’s time to dig into some running numbers.
Possession is a reasonable starting point. Your team keeps the ball, the other side has to run around trying to get it back. The connection is obvious.
Sorry, no. There’s no link, it’s random. We can plot the distance Liverpool have covered against their share of the ball in the 29 league matches since the home Merseyside derby, the first fixture for which BBC Sport posted the data. Spearman’s rank correlation coefficient suggests it’s borderline impossible for there to be less of a relationship.
Start with a blank chart. Throw a few darts. It might make more sense.
Liverpool’s top six matches for distance covered stretch across the possession scale from lowest to (almost) highest. You can eke out a touch more correlation if you use the opposition’s figures instead, just nothing of any significance.
Another thought: maybe the kilometres logged by both teams combined are related to how much time the ball spends in play? The dead ball, meatwall Premier League involves a lot of standing around waiting for set pieces to be taken these days.
Te relationship is a little stronger. It’s still only 0.20 on the Spearman scale that goes from 0 (no correlation) to 1 (perfect relationship) though. Keeping the ball in play does not result in teams running further.
This chart brings something into focus: the distance that two teams collectively cover can vary wildly. The range goes from 204.1km to 235.7km, it’s huge.
Find the home game with Everton and the defeat at Crystal Palace on the above graph. Those games were just one week apart yet are at opposite ends of the spectrum for total ground covered .
Remember how Jürgen Klopp famously challenged his teams to log 120km in matches? The Reds have seen three teams hit that mark against them without getting close to it themselves.
But if you review the chart again, you’ll see that three of Liverpool’s four highest match distances occurred in those games. The first of them, at Selhurst Park, was preceded by a Carabao Cup tie with Southampton. Arne Slot made 11 changes from his Everton line-up for that game, then 10 more for the league match against Palace. It seems logical that the Reds could then cover more ground.
However, two of the other examples of Liverpool breaking 114km (against Brentford and Brighton) were following Champions League away games in midweek. In tiring circumstances in which you’d assume a team’s ability to log distance would be hindered, it appears it was not.
If we take the post-European league games as a set, we find that the gap in distance covered between the Reds and their opponents grows. That seems reasonable enough.
What will surprise you is that Liverpool’s sprint distance and percentage of total distance at top speed goes up in league games that directly follow Champions League encounters. It doesn’t feel that this can be possible, especially in a season in which the Reds have looked off the pace physically so often.
As Liverpool have covered less distance than their opponents in 27 of the 29 games in the sample, the sprint numbers - for which they lead the opposition 15-14 - are more interesting. While the differences for individual games inevitably fluctuate, the Reds have been outsprinted by just 60m per game this season, six metres for each outfielder at any given time. It’s nothing.
Sprinting further appears to help. Liverpool have won seven of the 15 matches in which they led the highest speed running distance, averaging 1.67 points-per-game; they won five of the other 14 with a 1.29 ppg rate.
There are also 14 games in the sample in which the Reds lost the distance covered battle but sprinted further than their opponents. That feels like a positive without there being the correlation of games won to back it up. If seeing your side being outran feels instinctively bad, the data shows what a muddy picture it is.
Like any stat, nothing it tells you for a single game means all that much. And remember: Liverpool finished 16th for distance covered in 2024/25, first in the league table.
Couple of comments
1) sprint distance is definitely more important than total distance
2) my hypothesis is that the distance gap between the teams in a given match is what matters. If the gap is small then it is of no real consequence, but once it gets above a certain level (e.g 5km+) then it has an increasing influence on the match result.
For context:
120km as a team is high
100km is low
10km can be used as a rule of thumb for an outfield player, 5km = half a player
5km is also the equivalent of the team going the full length of the pitch 5 times.
Brighton outrun Chelsea 119-111 last night
good stuff Andrew ... the ppg when we get substantially out run (Dan's post) is striking even when factoring the Fulham result ... aside from that, it seems like, while it's the only data we have, aggregate distance (even limited to sprints) is too crude a measure to glean anything ... much more telling would be the situational stats that the clubs probably measure, i.e. sprints in threatening situations in attack or defense by game state and time during a match