
Walk, Don't Run: Liverpool's Physical Evolution from Klopp to Slot
The link between injuries and points was clear for Liverpool throughout Jürgen Klopp's tenure. How have things changed under Arne Slot?

Jonathan Northcroft recently wrote an excellent article for The Times titled ‘How Liverpool knew Arne Slot was the right man for them’. If they didn’t know when he was appointed, they certainly do now.
Among various tidbits of information, there were two - likely related - which stood out. The first was Slot’s track record for keeping players fit:
“He achieved 90 per cent player availability in every season at Feyenoord and the bad news for title rivals is his teams’ record of improving in the second half of campaigns.”
This is excellent news. Having tracked the Reds’ rate of absenteeism for almost nine years, it has long been clear that their performance level tracks closely with how many players have been unavailable. This was hardly a revelatory discovery but it never seems to be talked about in any detail whenever teams have below par seasons. Mikel Arteta is doing his best to turn this particular tide, in fairness, with a narrative-hungry media keen to help him.

Liverpool’s Premier League title challenge fell away sharply in Jürgen Klopp’s final months; when you look at the above chart, it’s remarkable they topped the table in the first week of April in the first place. The Reds were faced with a level of injuries not seen since 2020/21, a season for much of which midfielders or lower league centre-backs had to man the heart of the defence.
It is encouraging as we enter the second half of 2024/25 that Slot has a strong record of keeping his squad healthy. How does he do this? A chart from Northcroft’s article probably explains why the Dutchman has a better record than his Liverpool predecessor.

This makes as much sense as the apparent link between injury rates and points. If you don’t run as far and do so at high speed less frequently, the chance of a fitness problem will be lower. “Beat the dross, win the league” is a phrase which sums up that the title winner probably had a near-perfect record against the bottom half of the table. Perhaps Slot can prove that “run less, win the league” has merit too.
Sprinting has been on the increase in the Premier League in recent years. Despite what the graphic suggests about high-speed runs, Liverpool’s data from 2024/25 implies they might be sprinting more now.
Sky Sports share sprint data fairly regularly, particularly in their end of season round-ups. An article from October 2024 contained this graph:
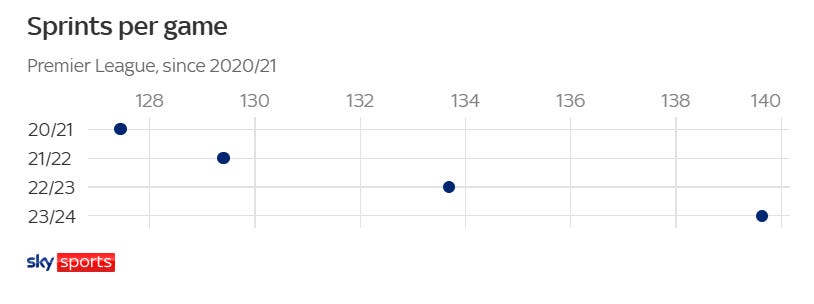
Klopp laughed heartily when he saw those numbers (probably). From data I found, in his final three seasons Liverpool averaged 138.9, 146.0 and 160.4 sprints per game respectively, keeping them about two seasons head of the Premier League average, even as it increased year after year.
Sadly, the most up-to-date figures I could locate for 2024/25 only cover the first six games of the league season. However, they suggest the Reds are making 176.7 sprints every 90 minutes. A game-specific source noted Mohamed Salah recorded 31 at Ipswich in the opening game of the campaign. The best season long average from a Liverpool player with a decent sample was 26.7 sprints per 90, which Darwin Núñez logged last season.
The problem here is that we may be comparing unfair data sets. You would expect a player to be closer to their physical peak in their first competitive match of a season rather than throughout the nine month slog of a full campaign. If we only looked at the first six games of each season, it’s likely the sprint averages would be higher than they are by the time May rolls around.
There’s also an important data differential to note. The chart in The Times used high speed runs from PFF, but according to their definition such bursts are not as quick as sprints. It also showed Liverpool’s standing in the Premier League, not their rate per match; maybe other teams are running quickly more often than they did while the Reds remain broadly the same.

Nonetheless, with several seasons of sprinting data collated via various Sky Sports articles, we can still make some interesting discoveries. For instance, Salah’s sprints per 90 decreased slightly over the last couple of seasons, even though the team’s average was rising.
The figure for this season has an asterisk as discussed, though a cynic would suggest a player looking to secure a lucrative new contract probably would try a bit harder. The preceding decline was inevitable too. Even a player as physically fit as the Egyptian cannot outrun age entirely. The data for the whole squad (of outfielders) between 2021/22 and 2023/24 proves the point.
The blip for age 29 is interesting. Liverpool’s legendary front three were all this age in their final campaign together three years ago; was this a final, glorious, hard running hurrah? Team 29’s average is lifted further by the remarkable engine of Andy Robertson last season.
In 2023/24, the Scot averaged 22.8 sprints per 90, a rise on the season before, even though he entered his thirties during the campaign. Only playing a shade under half the available minutes no doubt helped, but nobody else over the age of 25 hit that mark in the last three seasons.
Does him being so much of a sprinting outlier at a veteran age explain why Robertson has looked a yard off the pace at times in 2024/25? It would be surprising if it wasn’t at least part of the reason. From the limited available data, he averages 21.7 sprints per 90 this season so has seen a mild downturn.
With Premier League sprint rates always rising the Reds may have to try to keep up, even if their tally of high-speed runs appears to have declined. If there is a link with injury rates, though, it could remain in their interest to ease off where possible.
As the injuries versus points line graph near the top of the page suggests, Liverpool’s best half seasons have coincided with them having fewer injuries. With 19 games to go, the Reds will be in great shape to become champions if they can get at least 40 points. Here’s a target for Slot: don’t be without more than three players per match on average. History suggests he’ll add the Premier League title to his personal honours board if that is the case.
Take care out there, Red men. Walk, don’t run.
Please can I ask. How much of the trends above do you think are due to sprints and intensity in matches versus in training? Klopp’s training methods were notoriously very tough and intense. I think some players would say that Klopp training was deliberately harder than matches. My sense is that it’s not just matches, but also training, perhaps even more so training, that also explains the trends in this article. Many thanks for an excellent article
Fantastic article! The correlation between number of injuries and points is dramatic.